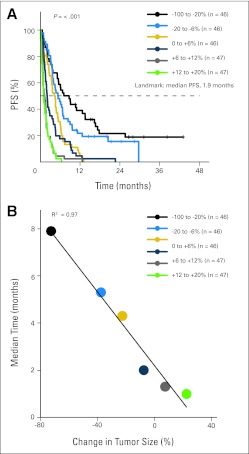
Fig A2.
(A) Kaplan-Meier analysis of progression-free survival (PFS) based on tumor response using the landmark analysis. Patient cohorts are separated such that there are equal numbers per cohort (except at the extreme representing the greatest shrinkage, where the cohort is enlarged owing to small patient numbers). (B) Each cohort's median PFS is plotted against its mean change in tumor burden. Linearity is assessed by using least-squares fit and calculating the correlation coefficient R2.

