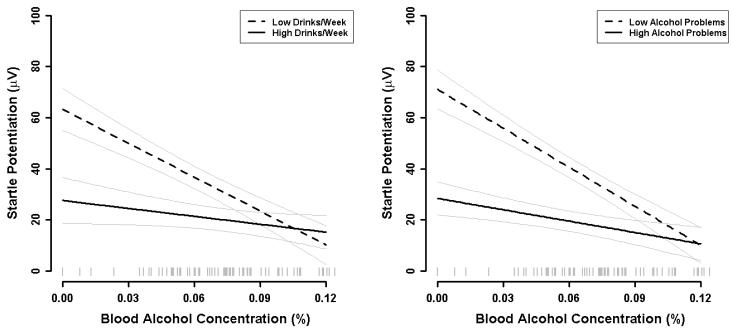
Fig. 3. Individual different moderators of BAC effect.
Left panel: Startle potentiation by BAC for participants with low and high weekly alcohol consumption. Point estimates for low and high alcohol consumption were obtained at + 1 standard deviation relative to the sample mean consumption (i.e., 0.5 vs. 18.4 drinks/week). Light grey lines represent standard error bands for point estimates from the general linear model for this analysis. A rug plot of observed BACs for participants in the sample is included along the x-axis.
Right panel: Startle potentiation by BAC for participants with low and high past year alcohol problems. Alcohol problems were measured with the Young Adult Alcohol Problems Screening Test (Hurlbut and Sher 1992). Point estimates for low and high alcohol problems were obtained at + 1 standard deviation relative to the sample mean problems (i.e., 1.7 vs. 8.2 past year problems). Light grey lines represent standard error bands for point estimates from the general linear model for this analysis. A rug plot of observed BACs for participants in the sample is included along the x-axis.

