
Fig. (1). The kinetics of RNAa and RNAi activity.
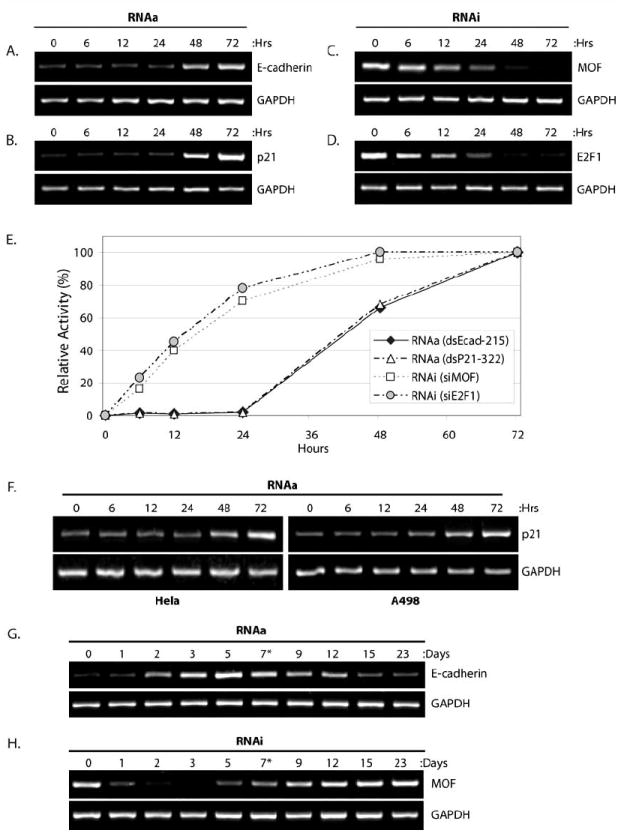
(A-B) PC-3 cells were transfected at 50 nM dsEcad-215 (A) or dsP21-322 (B) for the indicated lengths of time in order to monitor target gene induction via RNAa. Expression levels of E-cadherin (A) and p21 (B) were assessed by standard RT-PCR. GAPDH was also evaluated and served as a loading control. (C-D) PC-3 cells were transfected at 50 nM siMOF (C) or siE2F1 (D) in order to monitor RNAi at the indicated time points. Expression levels of MOF (C) and E2F1 (D) were assessed by standard RT-PCR. (E) Expression levels of E-cadherin, p21, MOF, and E2F1 following saRNA/siRNA treatments were quantified by optical densitometry at each time point. Maximal RNAa activity (100%) correlates to E-cadherin and p21 levels at 72 hours of saRNA transfection, while maximal RNAi activity (100%) correlates to MOF and E2F1 levels at 72 hours following siRNA treatments. Target expression levels at 0 hours designated no activity (0%) for both RNAa and RNAi. Rate of gene induction or target knockdown signify RNAa (dsEcad-215 and dsP21-322) and RNAi (siMOF and siE2F1) kinetics, respectively. (F) HeLa and A498 cells were transfected with dsP21-322 at the indicted time points. Expression of p21 and GAPDH were evaluated by RT-PCR. (G-H) PC-3 cells were transfected at 50 nM dsEcad-215 (G) or siMOF (H) for the indicated lengths of time. Cells were passed following day 7 as denoted by an asterisk (*). Expression levels of E-cadherin (H) or MOF (I) were assessed by standard RT-PCR. GAPDH was also amplified to serve as a loading control.