Figure 3.
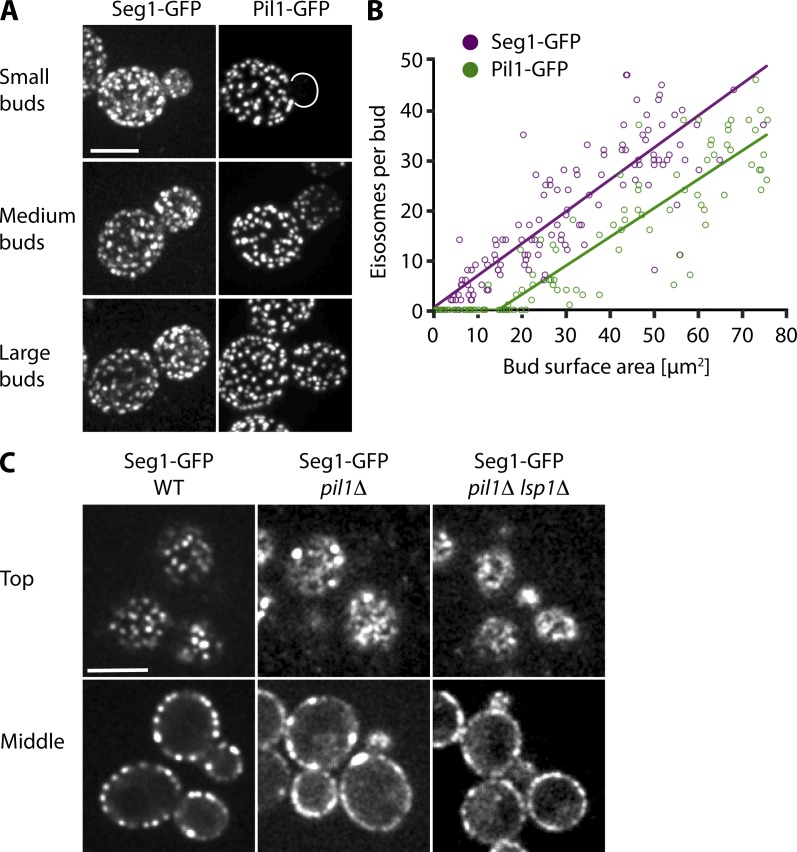
Seg1 precedes Pil1 during eisosome assembly. (A) Projections from confocal stacks of cells expressing Seg1-GFP (left) or Pil1-GFP (right). Representative images of small, medium, and large buds are shown. (B) Number of Seg1-GFP and Pil1-GFP patches per bud (determined from projections as in A), plotted against bud surface area and fitted using a biphasic model (see Materials and methods). (C) Confocal images of WT, pil1Δ, and pil1Δ lsp1Δ cells expressing Seg1-GFP. Representative top views and mid sections are shown. Bars, 5 µm.

