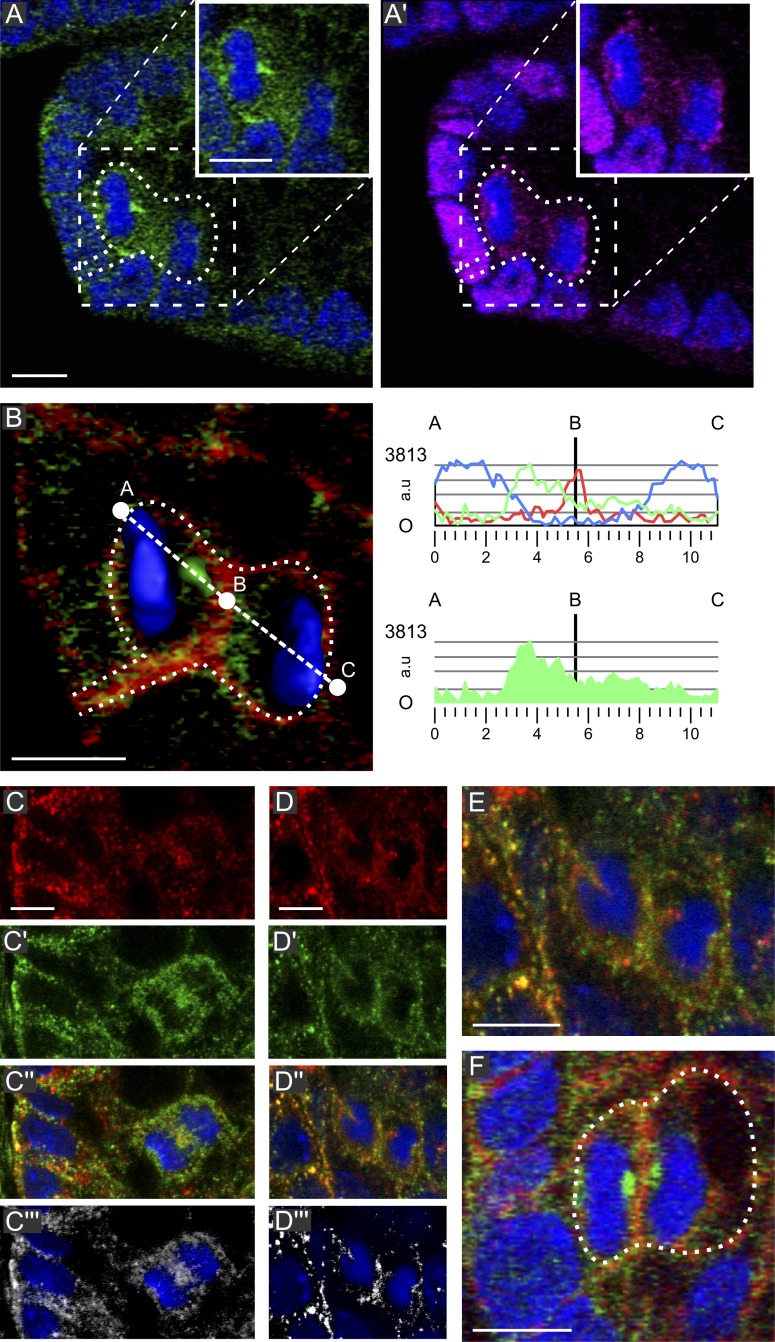
Figure 5.
Symmetric NuMA and asymmetric mNumb segregation. (A and A’) Telophase at position 3 in a wt crypt with asymmetrically segregating mNumb-containing vesicles (green) but two NuMA cortical crescents (magenta). The insets show the cell of interest without dotted lines. (B) Higher magnification (left) and fluorescence quantification (right) through the A–C line for mNumb (green), actin (red), and DAPI (blue). (C–E) mNumb signals of a rabbit anti–amino acids 489–522 (red) and a guinea pig anti–C terminus of mNumb (green); the rabbit antibody recognizes these more efficiently. (C–C′′′) Anaphase: mNumb containing vesicles accumulating in the spindle midzone; both antibodies label these structures as illustrated by the colocalization signal (C′′′). (D–E) Telophase: mNumb containing vesicles segregating into one of the daughters. (F) ApcΔ14/+ crypt: a telophase at position 4 with symmetric mNumb segregation whereby accumulations of vesicles are seen at each side of the cleavage furrow. The data shown are from a single representative experiment out of three repeats. The dotted lines delineate the cell of interest. Bars, 5 µm. a.u., arbitrary unit.

