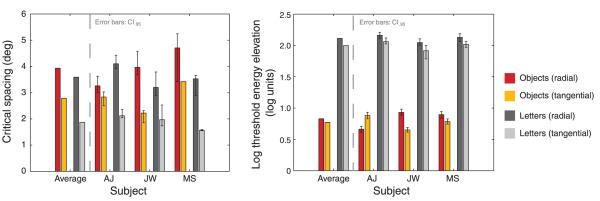
Figure 6.
Results for Experiment 1. The critical spacing is plotted on the left, while log threshold energy elevation is plotted on the right (a factor of two increase in threshold corresponds to 0.3 log unit). Asymmetric error bars represent 95% confidence intervals. There are no error bars on the averages, which are provided for descriptive purposes only. For every subject, critical spacing is larger in radial than tangential conditions, for both objects and letters. Threshold elevation is larger for letters than objects.

