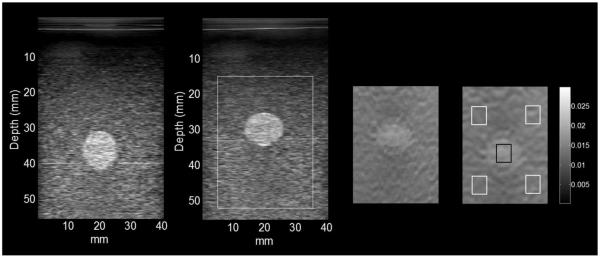
Figure 5.
Images from left to right are: the B-mode image at initial contact with the transducer, the B-mode image at 18.4% strain, the incremental strain images in the original coordinates and after 18.4% strain, and the incremental strain image at 18.4% strain with motion compensation. The regions of interest for contrast analysis are shown in the strain image on the far right. The background ROIs were placed near the corners to diminish the influence of the stress concentration on the contrast and the CNR. The ROIs adopted were the same for the FEA simulations and experimental results.

