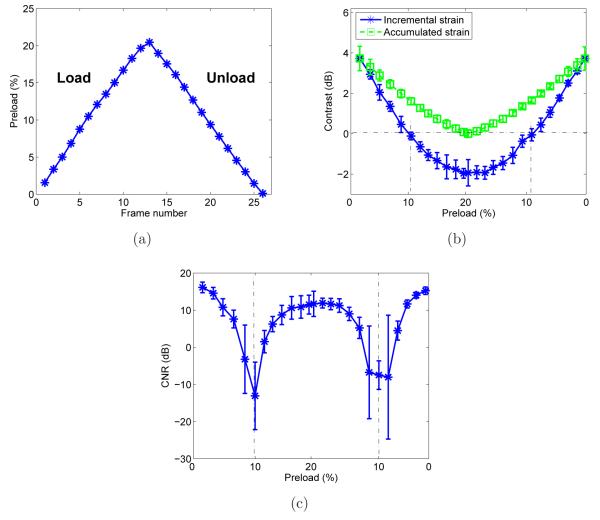
Figure 7.
Quantitative results obtained for inclusion 1 using the ROI’s represented in figure 5 showing: (a) accumulated average strain for each frame (b) contrast in the incremental strain image and the accumulated strain image during load and unload and (c) CNR calculated from the incremental strain image data.

