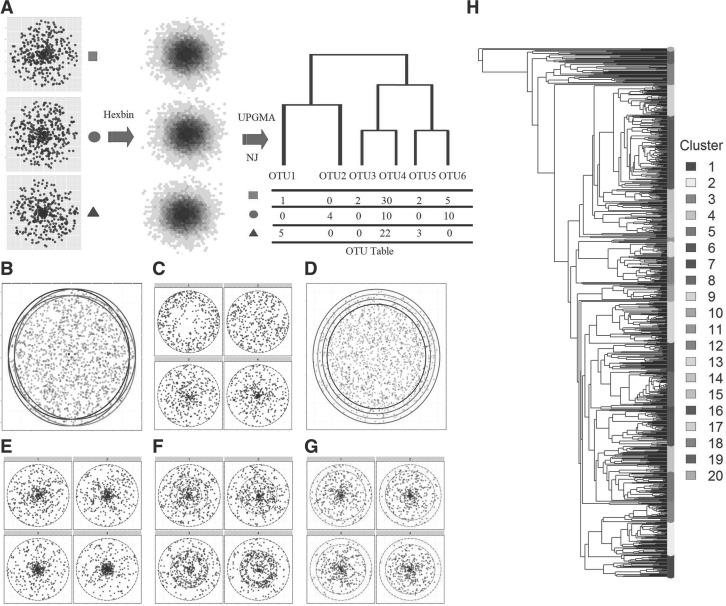
Fig. 1.
Two simulation strategies to evaluate the generalized UniFrac distances. (A–G), 2D circle-based simulation of microbial communities with different characteristics. (A) The microbial community is represented by a 2D circle. Points are drawn from the circle to simulate the 16S-based sampling process. These points are further binned into small hexagons as OTUs. UPGMA or NJ method is used to build the OTU phylogenetic tree. Six scenarios are investigated, where the difference occurs in: community membership (B), evenness (C), richness (D), most abundant lineages (E), moderately abundant lineages (F) and rare lineages (G). The affected lineages are indicated by a red circle or ring. H, tree-based simulation of microbial communities based on the phylogenetic tree and DM model. A real OTU phylogenetic tree from a throat microbial community dataset is used. These OTUs are roughly divided into 20 clusters (lineages) by performing PAM method using the OTU patristic distance matrix. Each cluster is subjected to abundance change in response to the environment. Counts are generated from a DM model.

