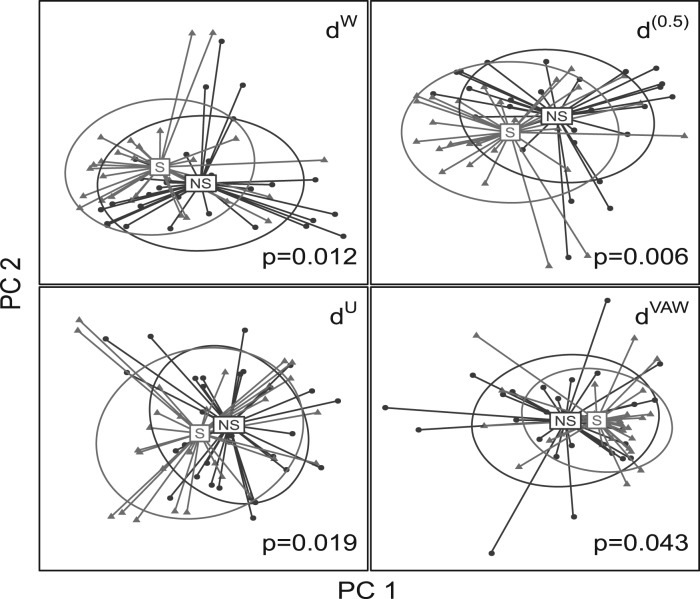
Fig. 5.
Comparison of different UniFrac variants for clustering samples from smokers and non-smokers. Principle coordinate analysis is performed on the distance matrices of dW, d(0.5), dU and dVAW. The samples are plotted on the first two principle coordinates. The PERMANOVA P-values are also indicated in this figure. The ellipse center indicates groups means, its main axis corresponds to the first two principle components from principle component analysis and the height and width are variances on that direction.

