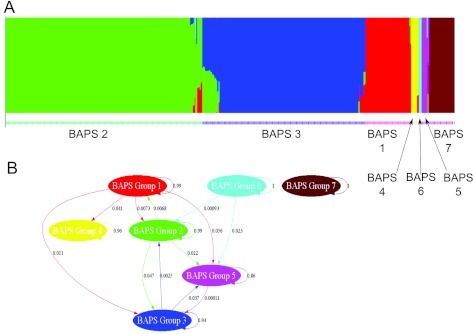
FIG 3 .
Admixture analysis in the Enterococcus population. (Top) Admixture analysis of 519 distinct enterococcal genotypes. Each column represents a single MLST and is colored according to the proportion of genetic variation assigned to each BAPS group. The final cluster assignment is shown by the color underneath. (Bottom) Gene flow network identified in the Enterococcus population. Arrows indicate the average fraction of sequence variation obtained from the source cluster by clones assigned to the target cluster. Circular loops indicate the fraction of variation estimated as not arising from outside the BAPS group.

