FIG 6 .
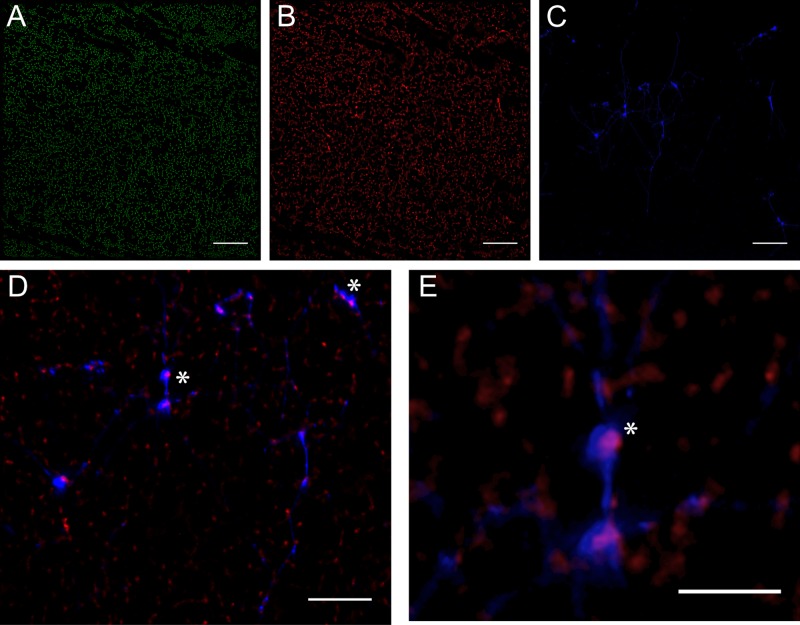
Elevated membrane potentials occur in a subpopulation of biofilm cells and are correlated with significant eDNA appearance. DiOC2 crosses the cell membrane, nonspecifically labeling all cells green (A). Cells with a nonzero membrane potential (ΔΨ) preferentially accumulate the dye, which, at these higher concentrations, leads to dye molecule aggregation and the appearance of a second, red fluorescent signal (B); metabolically active cells display both green and red fluorescence. The sample was also labeled with the anti-dsDNA antibody, here conjugated to a blue fluorophore (C). Overlaying the red and blue channels (D and E) reveals that >90% of cells immediately adjacent to areas with eDNA present (asterisks) not only demonstrate viability (ΔΨ > 0) but also display membrane potentials ~25% greater than the median. Bars, 25 µm.

