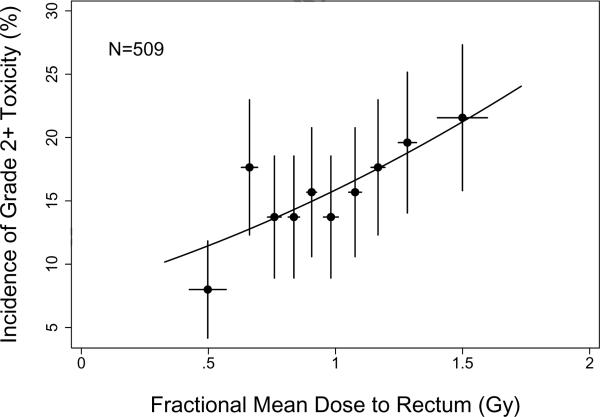
Figure 2.
Incidence of Grade ≥2 acute rectal toxicity in each of 10 subgroups of 50–51 patients. Points are plotted at the average (mean) value of fractional mean dose per subgroup. Horizontal error bars show ±1 standard deviation; vertical error bars show ±1 standard error computed using binomial statistics. The solid curve illustrates the fit of the Lyman-Kutcher-Burman model using fractional rectal DVHs.

