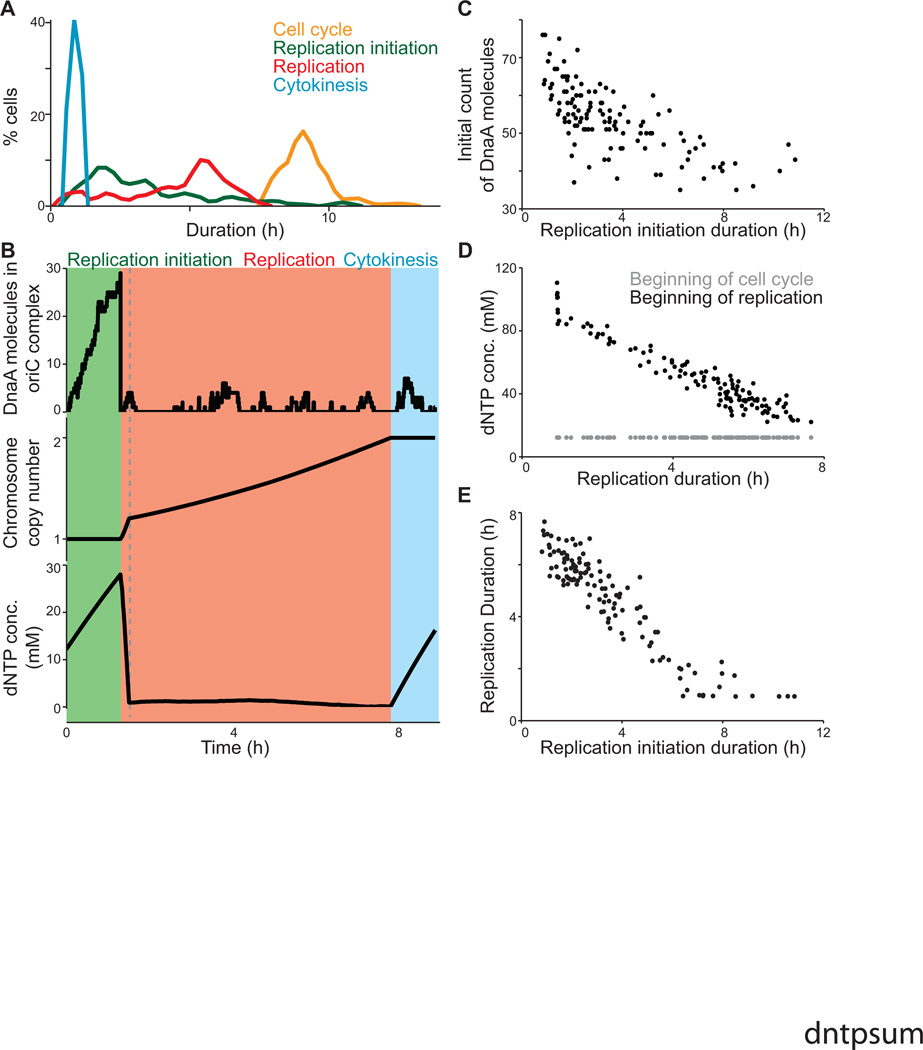
Figure 4. The model predictions regarding regulation of the cell cycle duration.
(A) Distributions of the duration of three cell cycle phases, as well as that of the total cell cycle length, across 128 simulations.
(B) Dynamics of macromolecule abundance in a selected cell simulation: top, the size of the DnaA complex assembling at the OriC (in monomers of DnaA); middle, the copy number of the chromosome; and bottom, the cytosolic dNTP concentration. The quantities of these macromolecules correlate strongly with the timing of key cell cycle stages.
(C) Correlation between the initial cellular DnaA content and the duration of the replication initiation cell cycle stage across the same 128 in silico cells depicted in (A).
(D) Correlation between the dNTP concentrations (both at the beginning of the cell cycle and at the beginning of replication) and the duration of replication across the same 128 in silico cells depicted in (A).
(E) Correlation between the duration of replication initiation and replication across the same 128 in silico cells depicted in (A).

