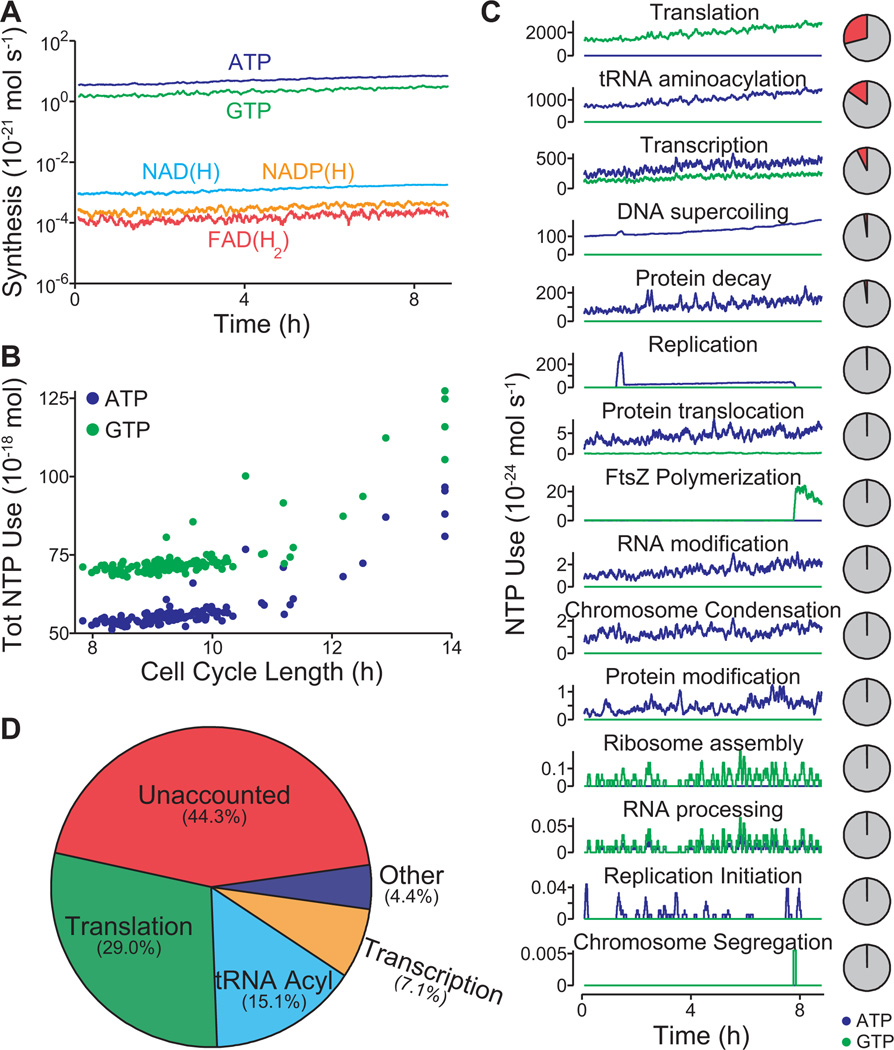
Figure 5. Model provides a global analysis of the use and allocation of energy.
(A) Intracellular concentrations of the energy carriers ATP, GTP, FAD(H2), NAD(H), and NADP(H) of one in silico cell.
(B) Comparison of the cell cycle length and total ATP and GTP usage of 128 in silico cells.
(C) ATP (blue) and GTP (green) usage of 15 cellular processes throughout the life cycle of one in silico cell. The pie charts at right denote the percentage of ATP and GTP usage (red) as a fraction of total usage. (D) Average distribution of ATP and GTP usage among all modeled cellular processes in a population of 128 in silico cells. In total, the modeled processes account for only 44.3% of the amount of energy that has been experimentally observed to be produced during cellular growth.

