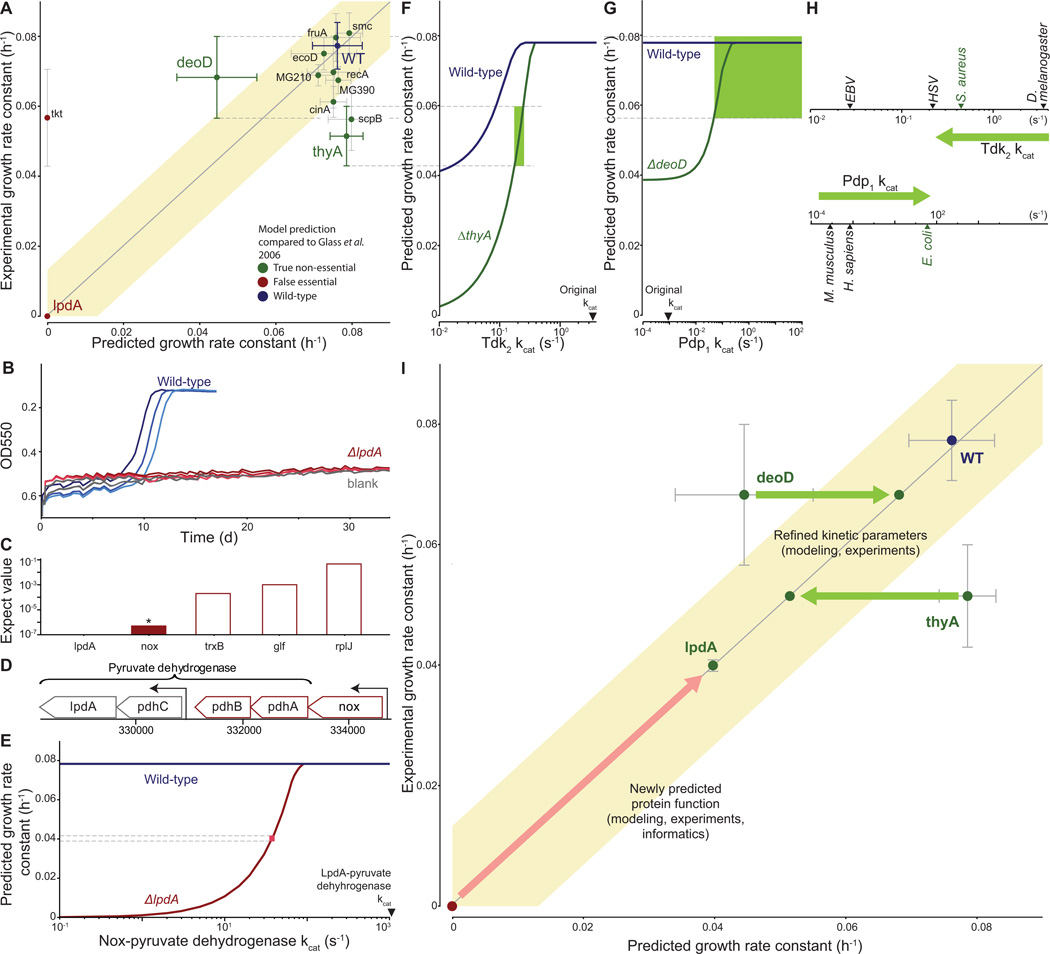
Figure 7. Quantitative characterization of selected gene disruption strains leads to identification of novel gene functions and kinetic parameters.
(A) Comparison of measured and predicted growth rates for wild type and 12 single-gene disrupted strains. Model predictions that fall within the shaded region were considered consistent with experimental observations; the region has a width of four times the standard deviation of the wild type strain growth measurement. Error bars represent s.d.
(B) Growth curves for the wild type and lpdA gene disruption strains and blank; similar to Figure 2A.
(C) Expectation values determined by performing a pBLAST search of the M. genitalium genome with the LpdA sequence as a query. The asterisk and colored bar indicate a significant match (E < 10−6).
(D) Detail of the M. genitalium genome. The pyruvate dehydrogenase complex genes are indicated by the top bracket, and transcription units identified in M. pneumoniae (Güell et al., 2009) are indicated by arrows. The transcription unit including nox is highlighted in color.
(E) Allowing Nox to partially replace LpdA in pyruvate dehydrogenase reconciles model predictions and experimental observations. The blue and red lines represent the predicted wild type and ΔlpdA strain growth rates as a function of the Nox-pyruvate dehydrogenase kcat. The pink box indicates the kcat at which the model predictions are consistent with both the wild type and ΔlpdA strain experimentally measured growth rates.
(F and G) Diagnosing the discrepancy between predictions and experiment for the thyA (F) and deoD (G) gene disruption strains. Some of the functionalities of ThyA and DeoD can be replaced by the enzymes Tdk and Pdp, respectively. The predicted growth rates of the wild type and gene disruption strains depend on the kcat of these enzymes. The green region highlights the range of kcat values consistent with the measured growth rates of both the wild type and gene disruption strain.
(H) Newly predicted kcat values are similar to values that were measured in closely related organisms. Measured values of kcat for Tdk (top) and Pdp (bottom) are shown; green arrow indicates the initial and revised kcat values. The nearest M. genitalium relative is highlighted in green.
(I) Model-based biological discovery. Comparison of model predictions to experimental measurements identified gene disruption strains of particular interest, including the lpdA, deoD and thyA disruption strains. Further investigation – using a combination of experiments, modeling and/or informatics – led to new and more consistent measurements and predictions. Most importantly, the higher consistency reflected novel insights into M. genitalium biology. The arrows (red for lpdA, green for deoD and thyA) indicate the shift from lower to higher consistency between model and experiment, and each arrow is annotated with the new biological insight and the supporting evidence in parentheses. The overall graph format is the same as Figure 7A.

