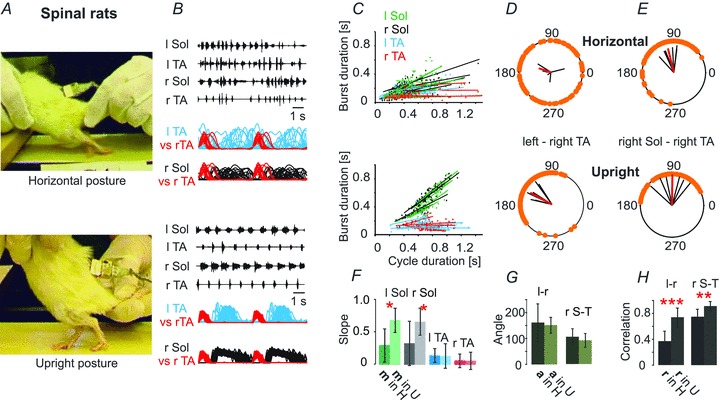
Figure 2. Spinal rats placed in the upright posture (n = 6) display near-normal locomotor patterns.

A, the same rat in the horizontal posture (upper panel) and the upright posture (lower panel) is depicted. C, the relationships between the step cycle durations and burst durations for the left and right TA and Sol muscles. F, bar graph showing that the slopes of this relationship differ significantly between the horizontal and upright posture trials (Student's paired t test). D and E, polar plots illustrating the interlimb (D) and intralimb (E) coordination changes that occur when the animals is placed in the upright posture (lower panel) compared to the horizontal posture (upper panel). G, bar graph showing the mean angle (a, ±SD) of polar plots for the left–right TA (l-r) and for the right Sol–right TA (r S-T) relationships. H, bar graph demonstrating the mean correlation coefficients (r, ±SD) for the left–right TA (l-r) and for the right Sol–right TA (r S-T) relationships, indicating a highly significant increase in r for inter- and intralimb coordination in the upright posture trials. Student’t test: *P < 0.05, **P < 0.005, ***P < 0.0005.
