
Figure 5. Effects of Cd2+ on the CO2/H+ response of a rostral pFRG/RTN neuron.
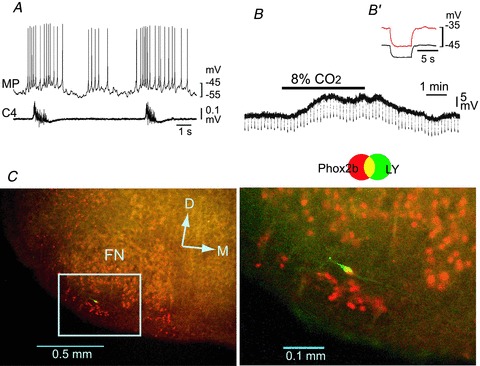
A, burst pattern in control solution. MP, membrane potential trace; C4, fourth cervical ventral root activity. B, membrane potential response to hypercapnic stimulation (2% CO2→ 8% CO2) in the presence of 0.5 μm TTX + 0.1 mm Cd2+. Negative deflections of the baseline membrane potential are proportional to input resistance. B′, a faster sweep representation (average of 5 traces) of the membrane potential response to application of 20 pA hyperpolarizing square current pulses in 2% CO2 (black trace) and 8% CO2 (red trace). Note that application of 8% CO2 induced membrane depolarization and an increase in input resistance. C, location of a recorded neuron stained by Lucifer yellow (LY, green). This neuron is Phox2b positive (red). Right panel, higher magnification of the highlighted square in the left image. FN, facial nucleus; D, dorsal; M, medial.