
Figure 3. Derecruitment of motor units.
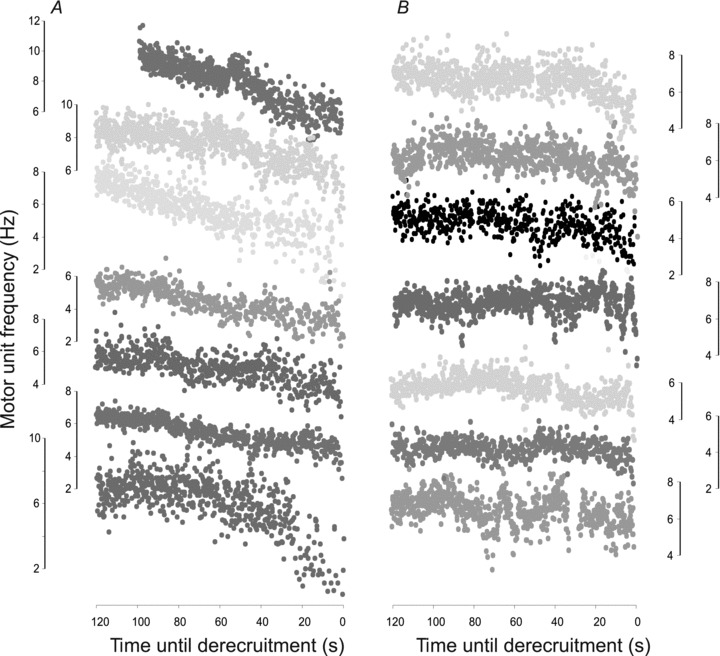
A, all units that showed a progressive decline in firing rate before derecruitment (n = 7). B, all units that maintained their firing frequency until 20 s before derecruitment. X-axes are time-shifted such that units are derecruited at 0 s. The frequency scale (Y-axis) for each unit is presented beside the corresponding data.