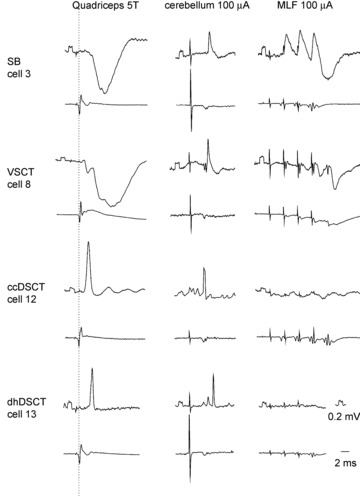
Figure 1. Representative examples of PSPs used to identify the four different populations of lumbar spinocerebellar neurons analysed morphologically.

In each pair of traces, the upper trace is an intracellular record from the cell indicated (negativity downward) and the lower trace is from the cord dorsum (negativity upward). All of the illustrated postsynaptic potentials in the left column were evoked by stimuli applied to the quadriceps nerve at 5 times threshold (5T). The dotted line indicates the afferent volleys. All rectangular calibration pulses at the beginning of traces are 0.2 mV.
