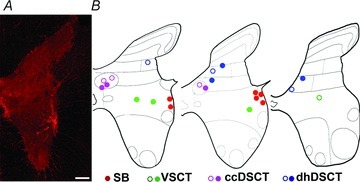
Figure 2. Locations of 22 intracellularly labelled spinocerebellar neurons.

A, a low-magnification image of a transverse section of the L3 segment of the spinal cord showing the location of one of the SB neurons (cell 5). B, diagrams illustrating the locations of cell bodies of all 22 cells in L3, L4 and L5 segments, respectively. Filled circles indicate location of the 15 cells which were analysed for both VGLUT1 and VGLUT2 while the open circles are for the 7 additional cells which were analysed for VGLUT1 only. Scale bar in A, 200 μm.
