
Figure 9. Scheme illustrating the generation of direction selectivity in the retina.
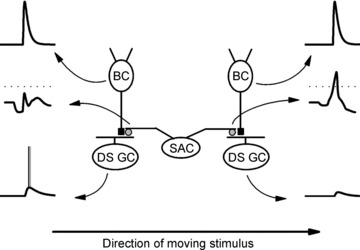
Two ON–OFF directionally selective ganglion cells (DS GCs) with opposite directional preferences receive excitatory glutamate-gated inputs (black squares) from two ON-centre bipolar cells (BCs) and inhibitory GABA-mediated inputs (grey circles) from two dendrites, which point in opposite directions, of the same starburst amacrine cell (SAC). The voltage traces associated with each of the cells and their processes (indicated by curved arrows that point to the traces from the cells/dendrites) represent the responses evoked by a light stimulus that moves from the left to the right. The upper voltage traces are from the BCs, the middle voltage traces are from the dendritic tips of the SAC, and the lower voltage traces are from the DS GCs. Unlike the SAC dendrites and the DS GCs, the BCs respond similarly to the moving light stimulus. The scheme illustrates that the SAC dendrite that points to the right, but not the SAC dendrite that points to the left, depolarizes in response to motion from the left to the right (indicated by the arrow at the bottom of the figure) and releases GABA. Because the GABA released from the rightward pointing dendrite suppresses the excitatory effect of the BC on the DS GC on the right, a null direction response (bottom right) to stimulus motion from the left to the right is produced. In contrast, the absence of GABA release from the leftward pointing SAC dendrite when the stimulus moves from left to the right allows the BC on the left to depolarize the DS GC on the left, producing its preferred direction response (bottom left). Because the release of GABA from the two opposite-pointing SAC dendrites is reversed when a light stimulus moves from the right to the left (not shown), the DS GC on the left produces a null direction response, while the DS GC on the right produces a preferred direction response. Dotted lines indicate Em=−40 mV, at which significant GABA release from the SAC dendritic tips can occur. See Discussion for further details.