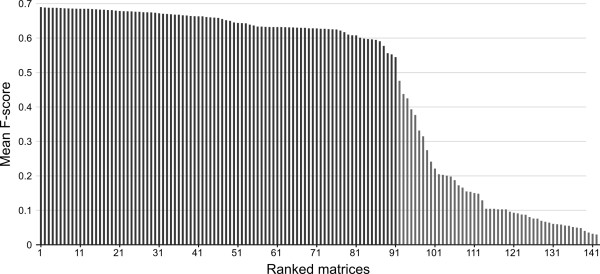
Figure 2.
Mean F-score of MSAs generated using 142 amino acid substitution matrices. MSAs were generated from 1000 randomly selected benchmark MSAs and inferred using MAFFT FFT-NS-2. Substitution matrices were ranked based on their mean F-score for this test set of benchmark MSAs. Based on these results, the first 91 top-ranked substitution matrices (all those scoring above a threshold of 0.5, shown in dark grey), were used for subsequent analyses.

