
Figure 1.
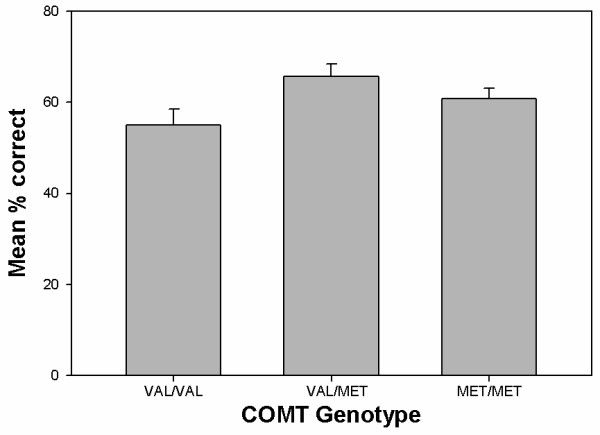
Mean percentage correct performance averaged across 0, 4, and 12 s delay conditions in the delayed-match-to-sample task (adjusted for age, IQ, gender, and medication status) as a function of COMT genotype. Error bars represent standard error of the mean.