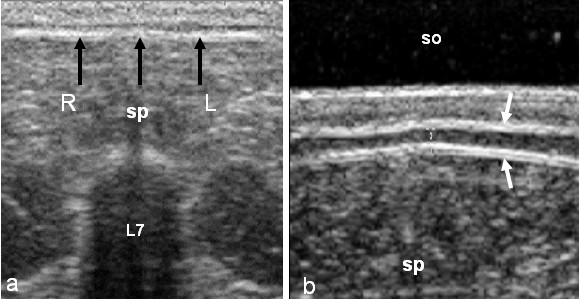
Figure 2.
Ultrasonogram of the measurement of fat layer. (a) Transversal sonogram demonstrates the places (arrows) to measurements of fat layer. (sp) spinous process of 7th lumbar vertebrae (L7), (R) right side, (L) left side. (b) Image in detail with the use of standoff (so). The fat layer is a hypoechoic line between two hyperechoic lines (arrows). (sp) spinous process

