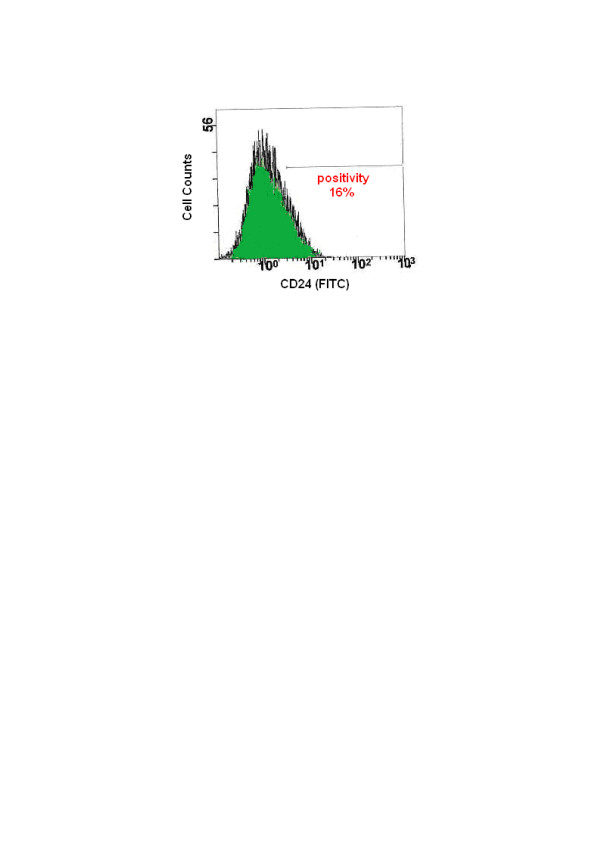
Figure 2.
Expression of CD24 in MCF-7 cells. Cells (104) were analysed by flow cytometry using CD24 monoclonal antibody (FITC). The histogram shows low level expression for CD24 in cells (positives - 16%). Both the plots of forward scatter (FSC) versus side scatter (SSC) were used to gate cells (not shown). To show positivity of CD24 an (FL1) plot was used (shown). For the Epics xL flow cytometer λ excitation = 488 nm and λ emission = 525 nm.

