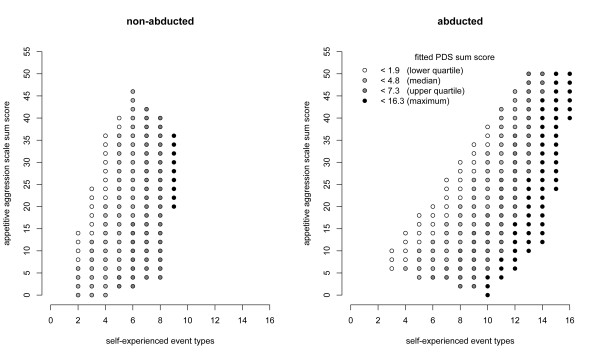
Figure 1.
Fitted PDS sum scores in the non-abducted and the abducted group. The scores are based on the best fitting linear regression model (see text for details). The grey scale indicates the predicted symptom severity. Only those PDS values are plotted that lie in the convex hulls of the observed predictor values in both groups.

