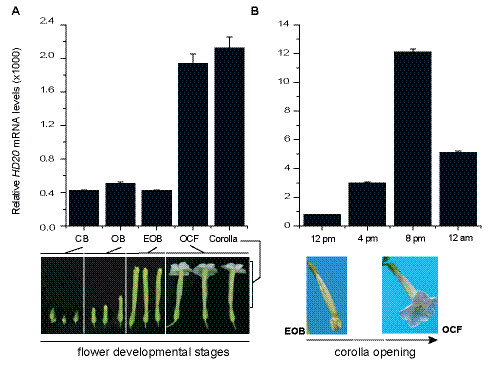
Figure 1.

Analysis ofHD20transcript levels during flower development. Total RNA was extracted from both, flowers at different developmental stages and corollas of WT N. attenuata plants. Total RNA was reversed transcribed and the HD20 mRNA levels were quantified by qPCR. Levels are expressed as relative units to the levels of the reference EF1A mRNA as calculated by the ΔCT method (n = 3, bars denote ± SE). (A)HD20 transcript levels were quantified in closed buds (CB), opened buds (OB), elongating opened buds (EOB), opened corolla flowers (OCF), and isolated corollas. Samples were harvested at 5 pm. (B)HD20 transcript levels were quantified in isolated corollas at different times during corolla opening.
