
Figure 2.
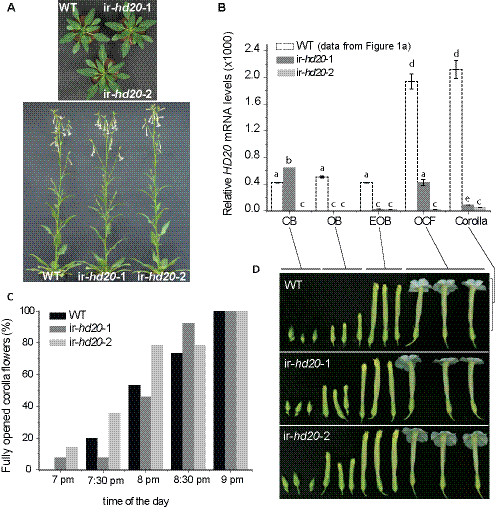
Morphology and development of ir-hd20 N. attenuataplants. (A) Morphology of ir-hd20 and WT plants in early rosette and elongated stages. (B) Analysis of HD20 mRNA expression in flowers of ir-hd20 and WT plants at different developmental stages. The data for WT plants is identical as for Figure 1a and was included only for comparison. Samples were harvested at 5 pm. HD20 transcript levels were quantified as detailed in legend of Figure 1. Different letters denote significant differences; univariate ANOVA, F14,44 = 26.64 P < 0.001 followed by a LSD post-hoc test P < 0.01 (different letters denote significant differences). (C) Kinetic of flower opening in ir-hd20 and WT plants (n = 10). (D) Morphology of flowers from ir-hd20 and WT plants at different developmental stages (CB: closed bud; OB: opened bud; EOB: elongating opened bud; OCF: opened corolla flower).