
Figure 6.
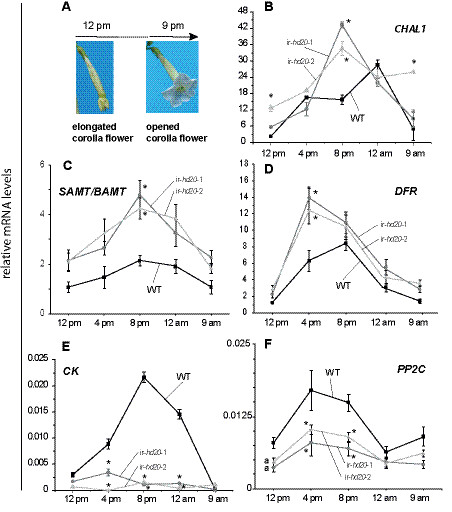
Analysis of gene expression during corolla opening by qPCR. Total RNA was extracted from isolated corollas of ir-hd20 and WT plants at different times during corolla opening. Total RNA was reversed transcribed and the mRNA levels for the different genes were quantified by qPCR. Transcript levels are expressed as relative units to the levels of the reference EF1A mRNA as calculated by the ΔCT method. Asterisks denote significant differences; univariate ANOVA F2,8 and P < 0.05 followed by a LSD post-hoc test P < 0.05 for both lines versus WT; n = 3; bars denote ± SE. (A) Schematic representation of corolla opening. (B)CHAL1 mRNA levels. (C)SAMT/BAMT mRNA levels. (D)DFR mRNA levels. (E)CK mRNA levels. (F)PP2C mRNA levels.