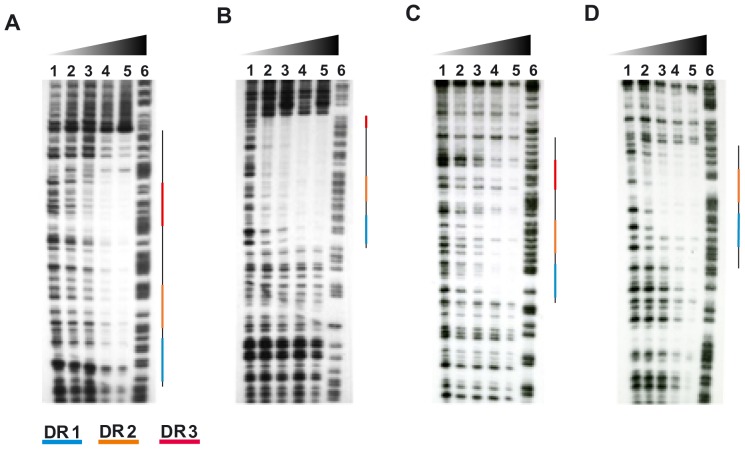
Figure 4. DNase I footprinting assay of the pks2 and msl3 promoter regions with PhoP-P.
Radiolabeled PCR fragments corresponding to (A) pks2 (−136 to +62), (B) msl3 (−312 to −79), (C) fadD21(−194 to +7) and (D) lipF (−639 to −450) were used as DNA targets. Various amounts of PhoP-P were used with pks2 and msl3 (lane 1: 0; lane 2: 1.8 pmol; lane 3: 3.6 pmol; lane 4: 7.2 pmol and lane 5: 14.4 pmol) and were incubated with 0.2 pmol of DNA before DNase 1 digestion. For fadD21 and lipF different amount of PhoP-P were used ((lane 1: 0; lane 2: 1.8 pmol; lane 3: 18 pmol; lane 4: 180 pmol and lane 5: 900 pmol) and were incubated with 1 pmol of DNA before DNase I digestion. Lane 6: A+G Maxam and Gilbert reaction. Protected regions are indicated by a line with colored regions. The blue, orange and red segments correspond to the DR1, DR2 and DR3 sites, respectively.

