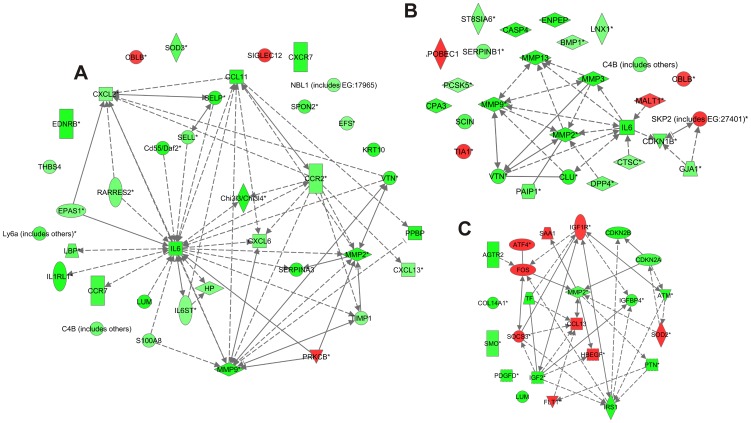
Figure 6. Molecular interactions involved in biological functions cell movement of leukocytes and metabolism of protein at 14 d time point, and proliferation of connective tissue cells at 21 d.
The diagrams show the differentially regulated genes involved in biological functions and the molecular interactions based on the literature in Ingenuity Knowledge Base. The expression ratios in the MMP-13 knockout (Mmp13−/−) granulation tissues compared to WT are visualized as heatmaps. Red color indicates upregulation and green color indicates downregulation in Mmp13−/− mouse granulation tissues. The intensity of the color implies the magnitude of the FC. The arrows and lines indicate direct (solid line) and indirect (dashed line) functional and physical interactions. The arrows show the direction of regulation. (A) Functional analysis of differentially expressed genes (FC>0.5, P<0.05) in Mmp13−/− granulation tissue compared to WT (14 d) revealed enrichment in the biological function cell movement of leukocytes (P<3.91E-10), which was predicted to be downregulated in Mmp13−/− mice (regulation z-score -2.28). (B) Functional analysis was performed as in (A). Enrichment of differentially expressed genes was found in the biological function metabolism of protein (P<6.75E-05) in Mmp13−/− granulation tissues, and the function was predicted to be downregulated (regulation z-score -2.40). (C) Functional analysis was performed as in (A). Enrichment of differentially expressed genes was found in the biological function proliferation of connective tissue cells at 21 d and the function was predicted to be upregulated in Mmp13−/− granulation tissue compared to WT (regulation z-score 2.69).

