
Figure 6. Average weight loss of pups at 24 and 48 hours post-infection with V. cholerae.
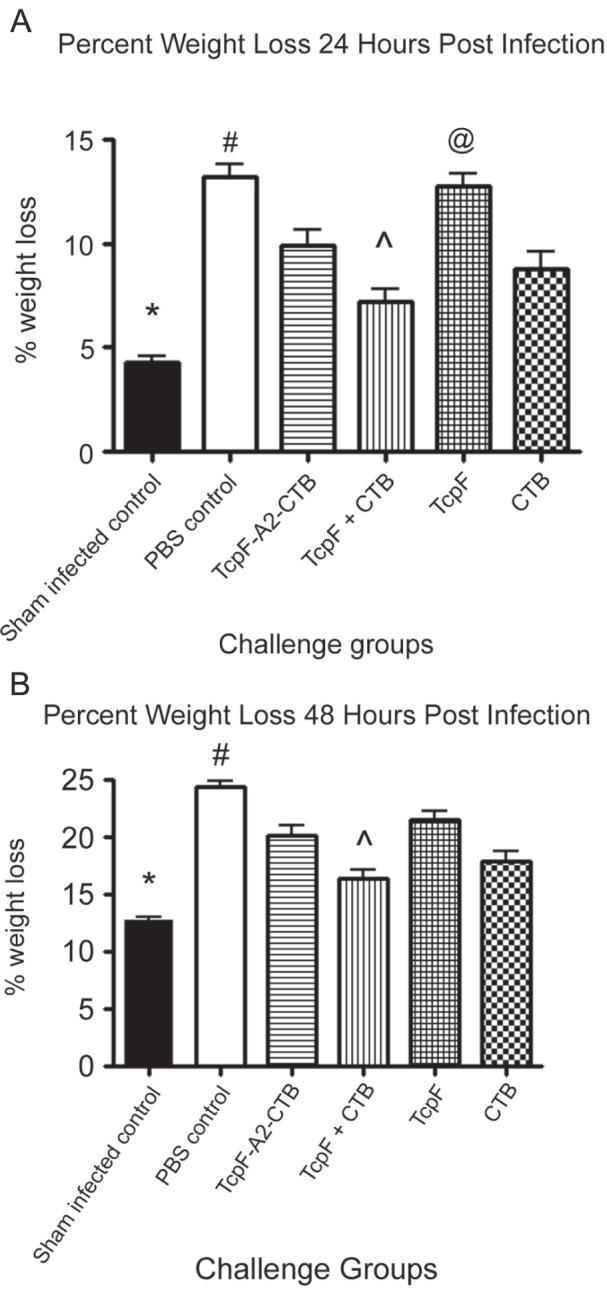
Pups were weighed immediately before, and 24 and 48 hours post-infection with 15LD50 of V. cholerae. Weight losses at 24 hours (A) and 48 hours (B) were compared to their initial weights at time = 0. Error bars represent the SEM. Statistical analysis was performed using ANOVA followed by the Tukey-Kramer post-test. Symbols 7A, *statistically different from all groups (P<0.05) except TcpF+CTB (P>0.05); #statistically different from all groups groups (P<0.05) expect TcpF (P>0.05); ∧statistically different from TcpF chimera and TcpF only groups (P<0.05); @statistically different from all groups (P<0.05) except the PBS group (P>0.05). Symbols 7B, *statistically different from all groups (P<0.05); #statistically different from TcpF+CTB and CTB only groups (P<0.001); ∧statistically different from all goups (P<0.05) except the CTB only group (P>0.05).