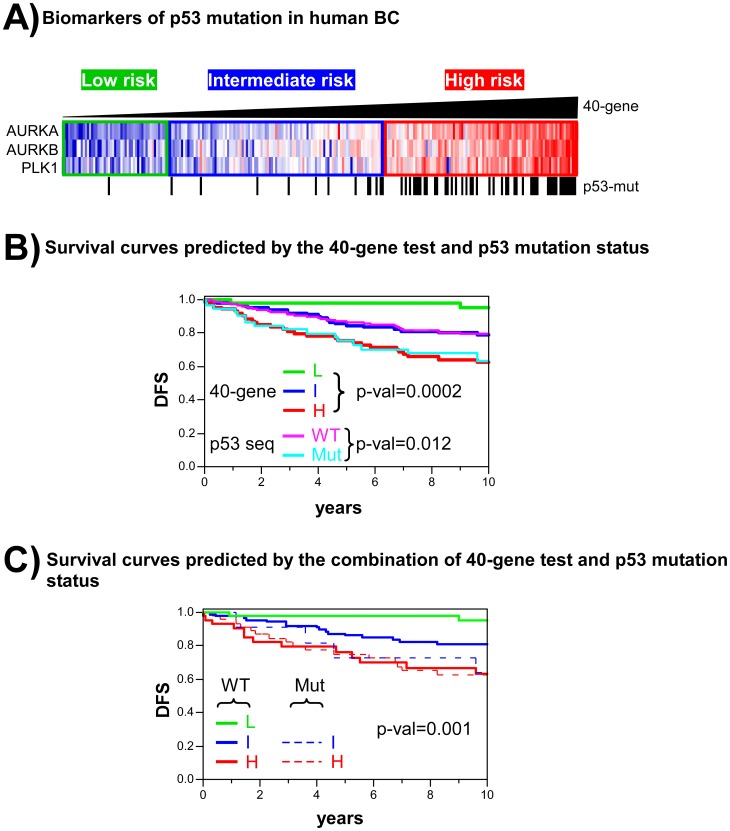
Figure 5. Comparison between the 40-gene test and p53 mutation status in terms of predicting the outcome of BC.
A) The AURKA, AURKB and PLK1 genes within the 40-gene test are overexpressed in human BC with p53 mutations. Tumour samples were ordered by p53 Risk Score as determined by the 40-gene test; risk groups are shown as low (green), intermediate (blue) or high (red) risk. Note the existence of high risk tumours without p53 mutations. B) Comparison of patient stratification determined using the 40-gene test and p53 mutation status in the Miller BC dataset. The survival curves of both stratification methods are shown simultaneously for the same patient dataset. p-val: significance of survival differences (log-rank test). C) Combination of the 40-gene test and p53 mutation status for stratifying patients with BC. Patients are grouped as p53-WT (L, I and high risk groups) or p53-MUT (low, intermediate and high risk groups). Only one sample out of 251 was classified as of low risk and p53-MUT; this was not included in the graph. p-val: significance of survival differences (log-rank test).

