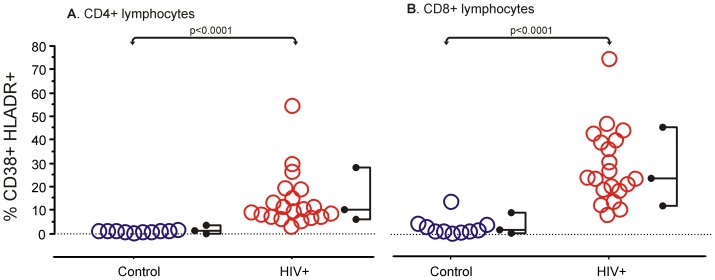
Figure 1. Immune activation as measured by CD38+HLADR+ T cells, CD4+ (A) or CD8+ (B).
Data for each subject is shown with the right hand fork encompassing 95% of observations and the middle prong at the median. There was significantly increased immune activation in HIV-1-infected patients (n = 20) when compared to controls (n = 10), measured by Mann-Whitney's U.

