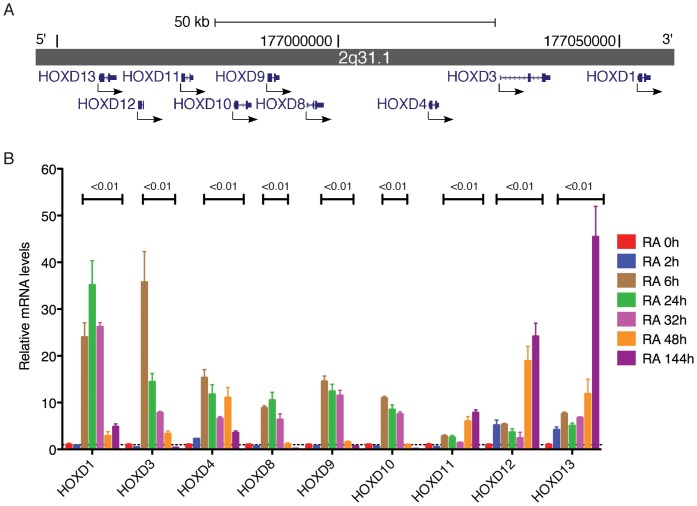
Figure 1. RA induction of HOXD genes in BE(2)-C cells.
(A) Genomic structure of the human HOXD cluster on chromosome 2q31.1, adapted from the UCSC Genome Browser. Arrows indicate the transcriptional direction of HOXD genes. (B) qRT-PCR analysis of HOXD mRNA levels at various time points following RA (10 µM) treatment. The HOXD mRNA levels in BE(2)-C cells immediately before RA treatment (RA 0h) were designated as 1.0 (dashed line). The data were from two independent samples with each being assayed in triplicates and analyzed using two-tailed Student's t-test with the p values indicated. Error bars, standard deviation (SD).

