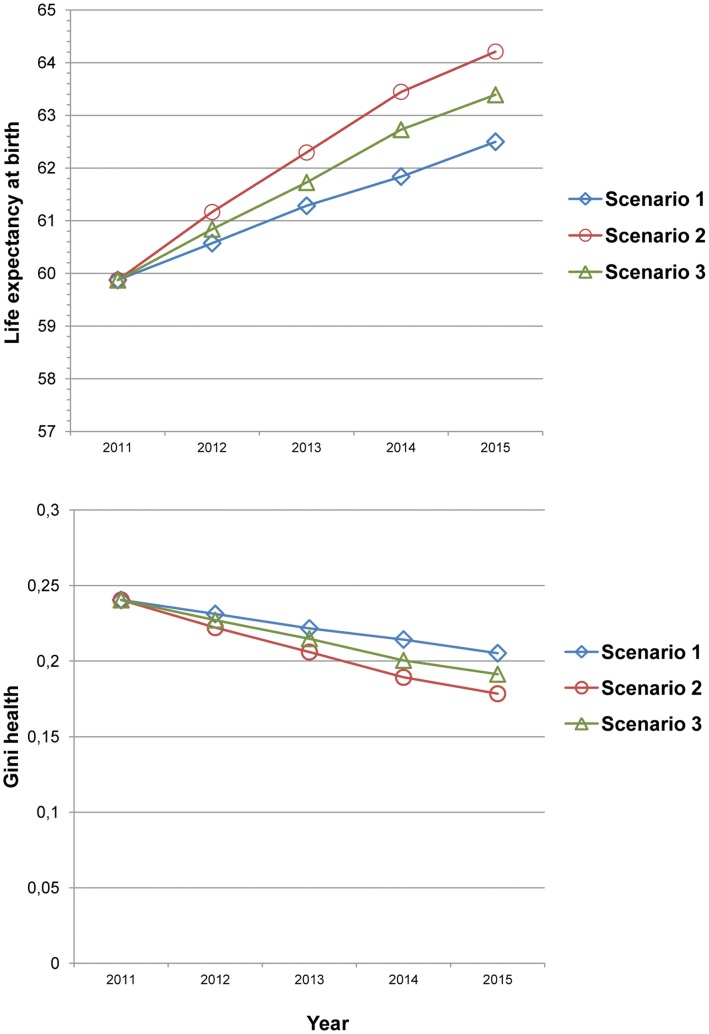
Figure 3. Temporal impacts on life expectancy and Ginihealth of scaling-up interventions between.
Scenario 1 is in blue (with squares), scenario 2 in red (with circles) and scenario 3 in green (with triangles). See Figure 1 and Appendix S1 for details about the different scenarios and interventions.

