
Figure 1. Up and Down states and Up-and-Down transitions in two different network models.
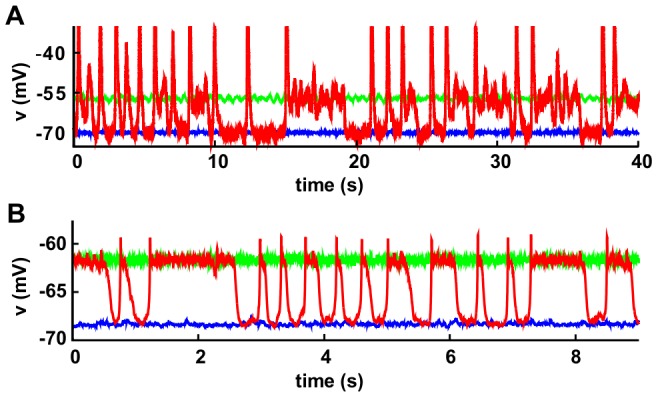
(A) Model A (mean-field model) [18]: time-series for the membrane potential,  . Observe the presence of two steady states lower one around
  mV (Down-state/blue curve) and a larger one (Up state/green curve) at about
  mV; these two are obtained for low noise amplitudes (
 mV
mV ,
, 
 ) and different initial conditions. Instead, the Up-and-Down state (red curve), corresponds to a high noise amplitude (
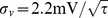 ,
,  ). Note that, typically the Up-state intervals start with an abrupt spike which parallels empirical observations as discussed in [18]. Parameters have been fixed as in [18]:
  s,
s,  s,
s,  mV/Hz,
  ,
,  mV,
mV,  mV, and
  Hz/mV. (B) Model B (network of spiking neurons) [21]: Time series of membrane potential. Curves and color code are as for Model A. For
  the system exhibits Up-and-Down transitions, for larger (smaller) values as
  (
( ), it remains steadily in the Up (Down) state. Parameters have been fixed as in [21]: vesicles per synapsis
  , resting potential
  mV, membrane threshold
  mV, capacitance
  pF, leakage characteristic time
  s, synaptic recovery time
  s, signal time decay
  s, refractory period
  s, input amplitudes
  pA,
pA,  pA, and external driving rate
  Hz.
Hz.