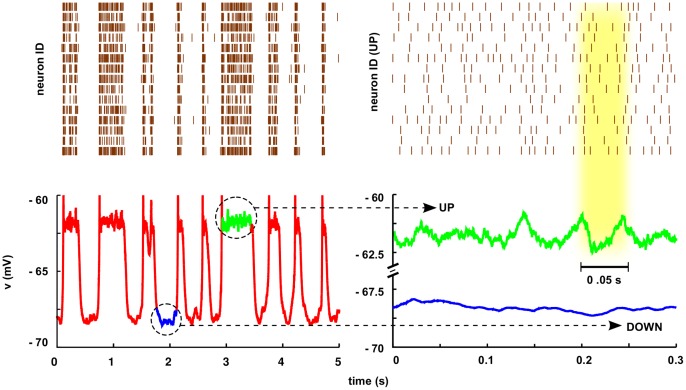
Figure 3. Raster plots and average membrane potential in the spiking-neuron network model (Model B).
Left: (Top) Raster plot of  randomly chosen neurons (out of a total of
  neurons in the simulation). Sticks are plotted whenever a neuron spikes. (Bottom) Time-series of the network-averaged membrane potential in the same simulation. Comparison of the two left panels (both of them sharing the same time axis) reveals that individual neurons fire often during Up states, while they are essentially quiescent in Down-state intervals. Right: (Bottom) zoom of an Up interval (green curve) and of a Down interval (blue curve); while the Up state exhibits quasi-oscillations, the Down-state does not. (Top) Raster plot of
  randomly chosen neurons during the Up state. Remarkably, their spiking frequency is not locked to the collective rhythm: it is about three times faster.

