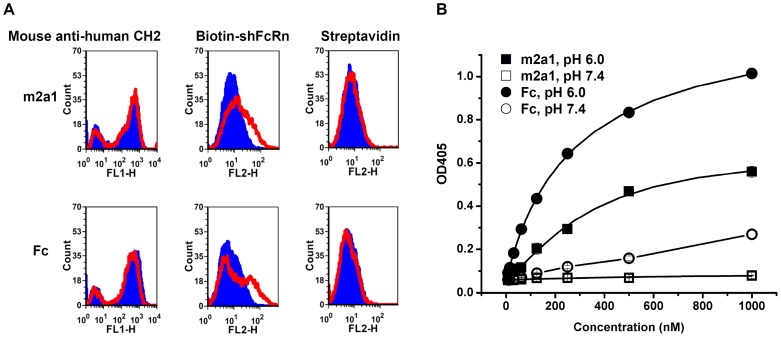
Figure 8. Binding of m2a1 to shFcRn.
(A) Binding of yeast-expressed m2a1 and Fc to shFcRn at pH 6.0 (red) and pH 7.4 (blue) measured by flow cytometry. Fluorescence intensity shifts were observed in both cases of m2a1 and Fc. The expression of m2a1 and Fc on yeast cell surface was detected by the mouse anti-human CH2 mAb. PE-streptavidin was used as negative control. (B) Binding of m2a1 and Fc to shFcRn tested by ELISA. The binding of m2a1 to shFcRn at pH 6.0 (▪) and pH 7.4 (□) was tested while that of Fc to shFcRn at pH 6.0 (•) and pH 7.4 (○) was used as control. m2a1 showed good pH-dependent binding to shFcRn although the EC50 at pH 6.0 was lower than that of Fc to shFcRn. Data presented as mean ± SD.

