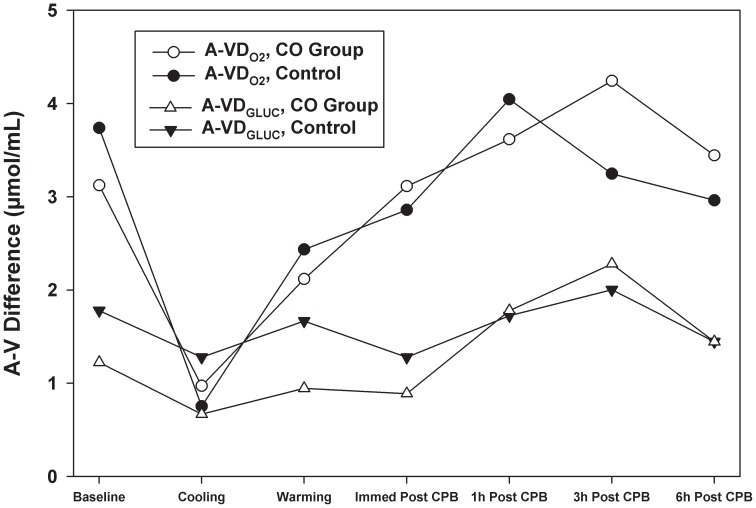
Figure 3. Arteriovenous difference in oxygen tension (A-VDO2) was greater than arteriovenous difference in glucose (A-VDGLUCOSE) except during cooling when A-VDGLUCOSE of the control animals was greater than A-VDO2.
A-VDO2 in the CO-treated group was higher at 3 and 6 hours after CPB. A-VDGLUCOSE was higher in the air group at baseline, during cooling and rewarming on CPB and immediately after CPB. While there were trends in A-VDO2 and A-VDGLUCOSE values between air and CO-treated animals, no significant differences were observed. Data represent the means ± SD of 6 animals/group.

