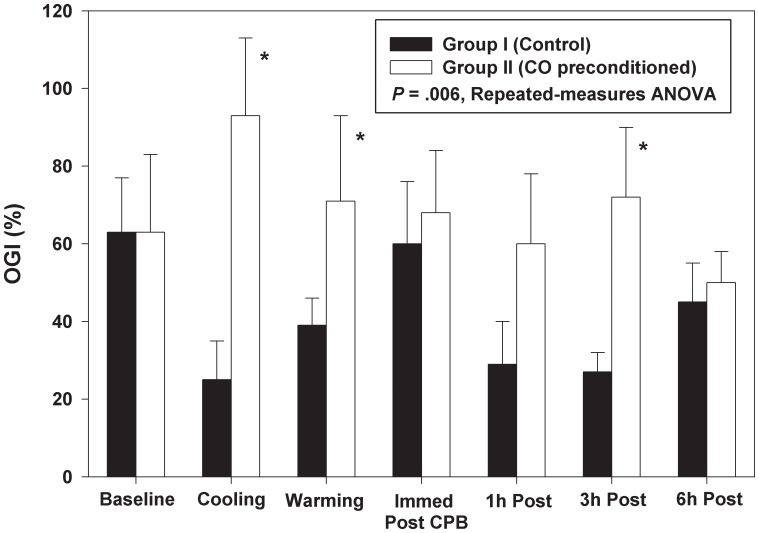
Figure 4. OGI(%) was similar at baseline in both groups, but was above baseline in the CO-treated group thereafter.
In the air group, OGI(%) was below baseline at all time points. Data represent the means ± SD of 6 animals/group, p = 0.006 repeated measure ANOVA. * indicates statistical significance.

