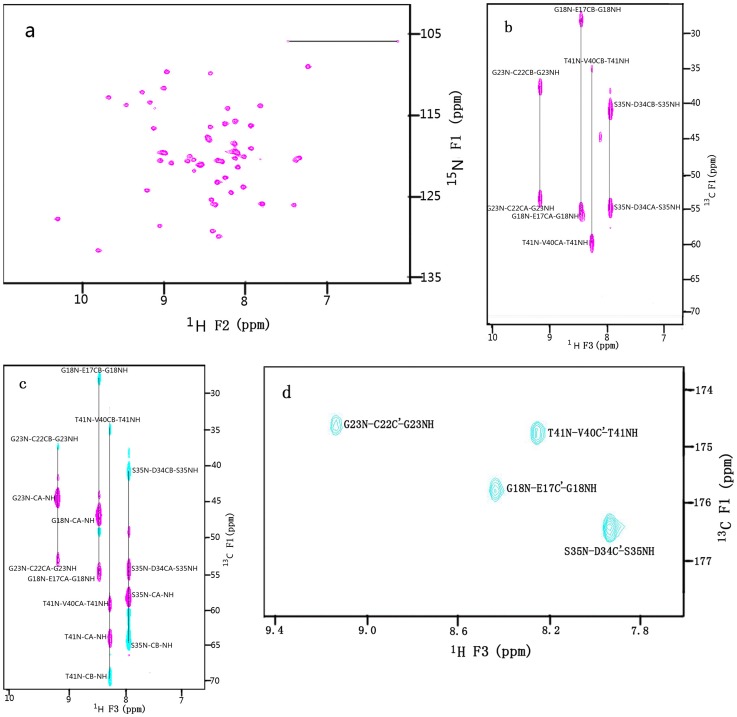
Figure 4. The 600MHz NMR spectra of 2.0 mM 15N, 13C-labeled RGD-hirudin (1–66) in 20 mM sodium phosphate buffer, pH 7.4.
a. 15N(F1 axis)-NH(F2 axis) region of the 2D 15N-1H Overbodenhausen correlation spectrum, b, c & d are selected 13C(F1)-1H(F3) planes at δ[15N(F2)] = 116.4 ppm of the 3D CBCA(CO)NH, CBCANH and HNCO spectra of RGD-hirudin (1–66) respectively. Sequential connectivities for four residues are indicated.

