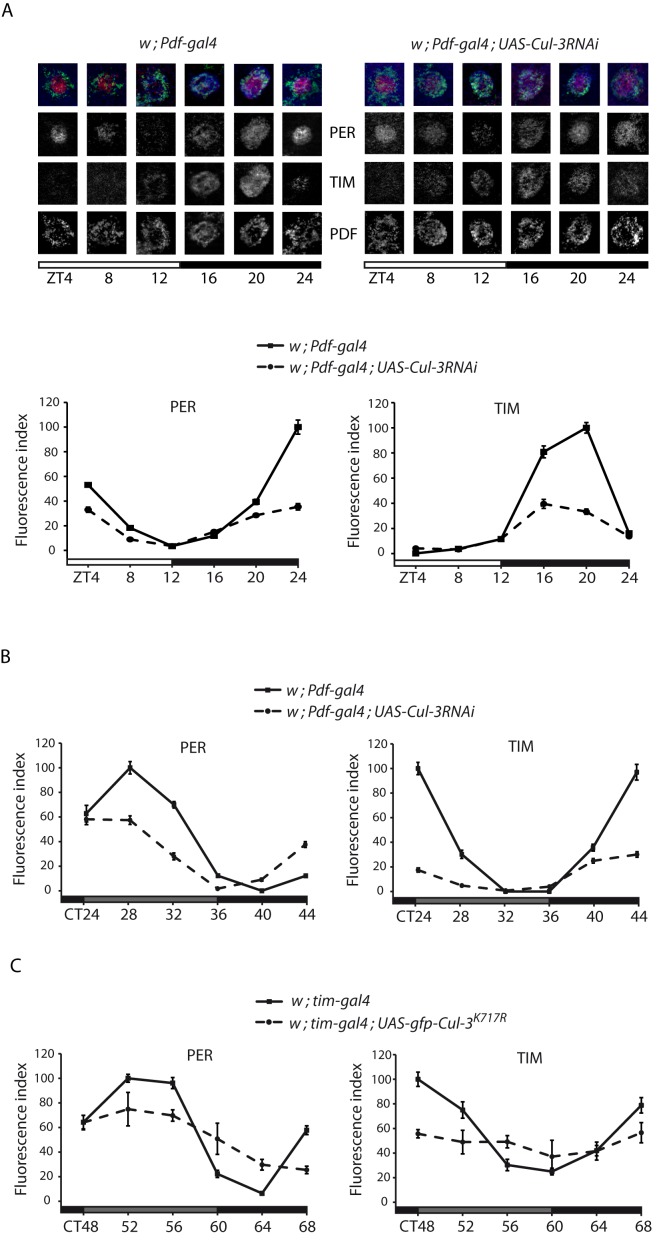
Figure 2. PER and TIM in the s-LNvs of flies expressing Cul-3 RNAi.
Flies were entrained for 3 d in LD and collected every 4 h on the fourth day of LD (A) or transferred to DD and collected on the second (B) or third (C) day of DD. Images are optical sections of individual PDF-expressing s-LNvs from Pdf>RNAi flies and controls in LD. Merged images: red is PER, blue is TIM, and green is PDF. Graphs represent quantifications of PER and TIM immunolabeling (see Materials and Methods) in the PDF-positive s-LNvs of Pdf>RNAi or tim>Cul-3K717R flies and relevant controls. White and gray bars indicate lights-ON and lights-OFF, respectively. Gray and black bars indicate subjective day and subjective night, respectively. Time (h) is indicated as ZT or CT (Circadian Time) where CT0 is 12 h after lights-OFF of the last LD day. Error bars indicate s.e.m. Two independent experiments were done for each genotype/condition with very similar results.

