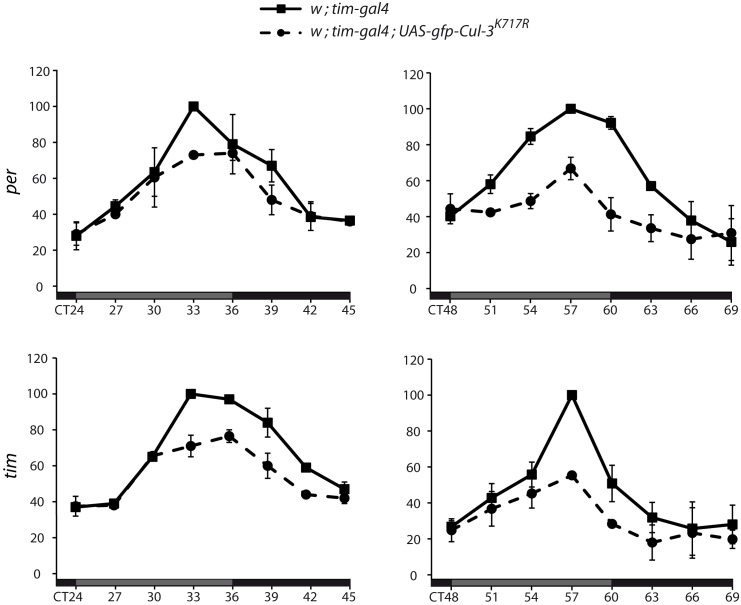
Figure 4. per and tim mRNA oscillations in flies expressing CUL-3K717R.
Flies were entrained for 3 d in LD and transferred to DD for collection every 3 h in the second (left) and third (right) days of DD. Relative per and tim mRNA levels in head extracts were determined by quantitative RT-PCR (see Materials and Methods). For each experiment, the averaged normalized values of both mutant and control genotypes were expressed as a percentage of the maximum value set to 100. Means of two independent experiments are reported in the graphs. Error bars indicate the range between the two experimental values.

