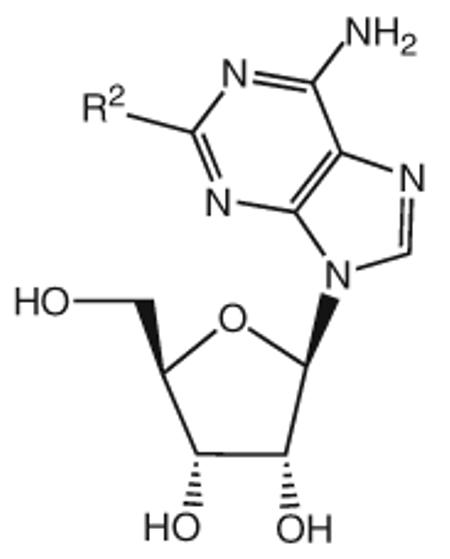
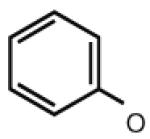
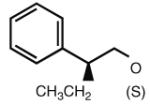
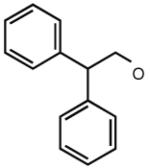
Table 2.
Binding affinities of monosubstituted adenosine derivatives (2-ether-substituted) at the human A3AR expressed in CHO cells and at A1 and A2A ARs, and maximal A3AR agonist effect

| Compound | Substitution R1 = |
pKi at A1ARa |
pKi at A2AARa |
pKi at A3ARa |
%Activation, A3ARa |
|---|---|---|---|---|---|
| 29 | Cl | 8.12 | 6.20 | 7.06 | 100 |
| 30 |

|
5.29 | 7.36 | 6.44 | 32 |
| 31 |

|
6.19 | 6.23 | 6.93 | 17 |
| 32 |

|
6.66 | 8.03 | 7.27 | 71 |
| 33 |

|
5.43 | 6.23 | 5.71 | ND |
| 34 |

|
6.28 | 7.21 | 6.51 | 72 |
| 35 |

|
6.66 | 7.75 | 6.85 | 1 |
| 36 |

|
6.54 | 7.19 | 6.98 | 91 |
| 37 |

|
5.32 | 7.57 | 6.76 | 0 |
| 38 |

|
<5 | 6.51 | 7.27 | 0 |
A3AR binding experiments were performed with membranes prepared from adherent CHO cells stably transfected with cDNA encoding the human A3AR, using as radioligand [125I]N6-(4-amino-3-iodobenzyl)adenosine-5′-N-methyluronamide ([125I]I–AB–MECA; 2000 Ci/mmol) at a final concentration of 0.5 nM, in Tris·HCl buffer (50 mM, pH 8.0) containing 10mM MgCl2, 1mM EDTA. Nonspecific binding was determined using 10 μM Cl–IB–MECA. The mixtures were incubated at 25°C for 60 min. ND, not determined. Maximal A3AR agonist effect is inhibition of forskolin-stimulated adenylate cyclase at 10 μMusing a reference value for Cl–IB–MECA of 100% (Gao et al. 2004)
