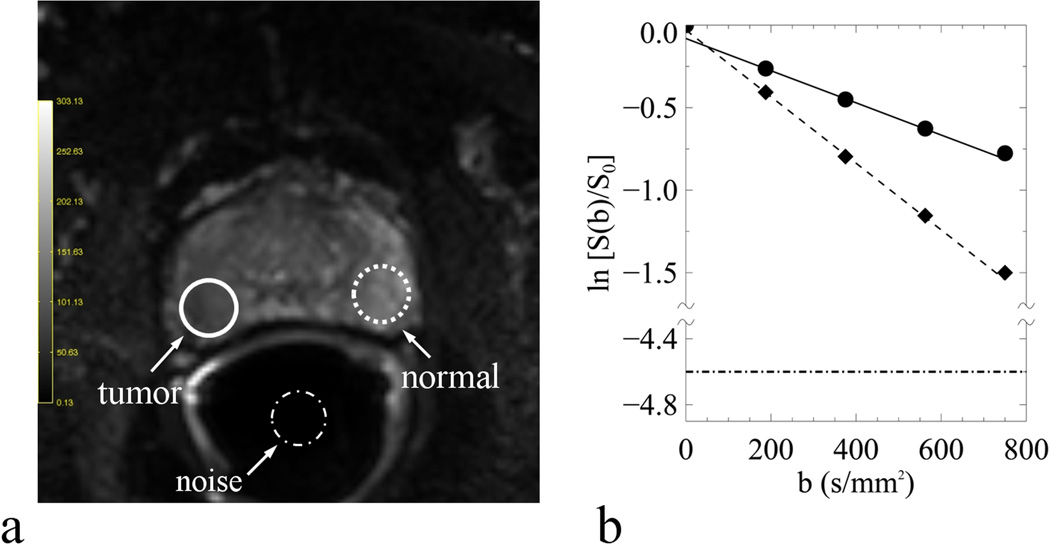
Fig. 2.
An example of normal (dash line), tumor (solid line) and noise (dash-dot line) ROIs on one DW-MR image (a) and the curve-fittings of normal (diamond) and tumor (circle) diffusion signals within the respective ROIs (b). The DW-MR image was obtained with b-value of zero and the straight lines were fitted with Eq. [4] using b-values of 188, 375, 563 s/mm2. Also included in (b) was the noise-floor shown as the horizontal dash-dot line, which was normalized to the normal tissue signal at b-value of zero with SNR of 100.

