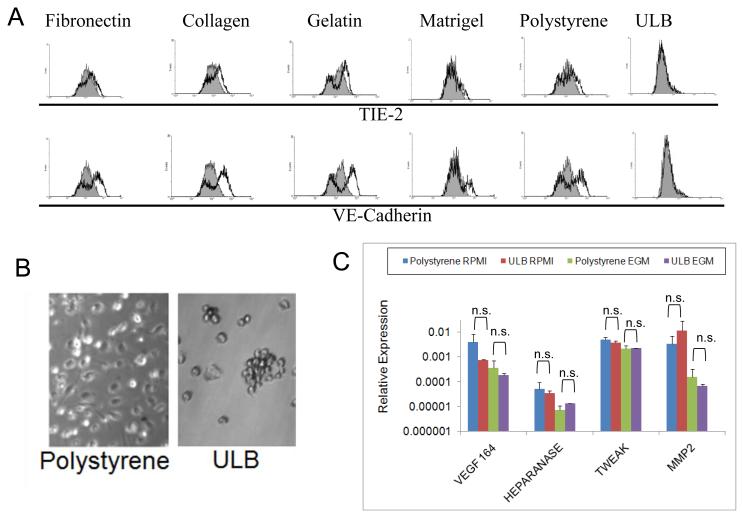
Figure 3.
Expression of endothelial markers and angiogenic molecules on mDC cultures. (A) mDCs were cultured for 1 week on different surfaces with EGM media. Cells were recovered from different cultures and analyzed by flow cytometry. Analysis was performed on CD11c gated cells. Grey histograms represent isotype controls. An experiment representative of 2 independent experiments is shown. (B) Microphotograph of mDCs after 3 week of culture on polystyrene or ULB surfaces (20X magnification). An experiment representative of 4 independent experiments is shown. (C) Expression of angiogenic molecules by 3-week DC cultures. mDCs were recovered from different cultures after 3 weeks in EGM or RPMI, RNA extracted and reverse-transcribed. Then, quantitative real-time PCR was performed to analyze several angiogenic molecules in these cells. Data were analyzed by ANOVA followed by Tukey-Kramer Multiple Comparisons post-test. Samples were run in duplicate in each experiment and further analyzed in duplicate by qPCR. An experiment representative of 2 independent experiments is shown.

