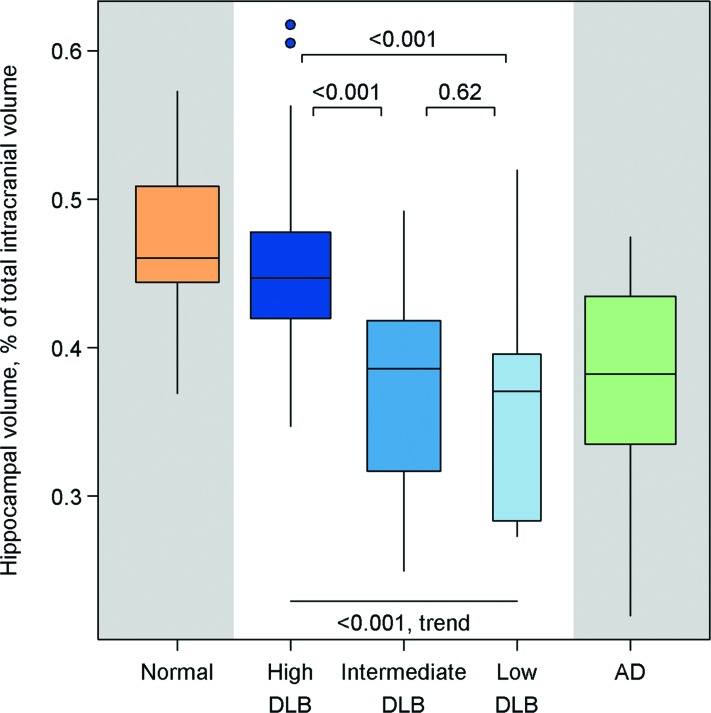
Figure 1. Box and whiskers plots of hippocampal volumes as a percentage of total intracranial volume by pathologic classification.
Boxes indicate the lower quartile, median, and upper quartile of the distributions with whiskers extending to the furthest data point within 1.5 times the interquartile range of the box. Points beyond the whiskers are individually identified. Pairwise p values shown are based on an analysis of covariance model among all subjects, whereas the p value for trend is based on subjects with dementia with Lewy bodies (DLB) only.

