Figure 1.
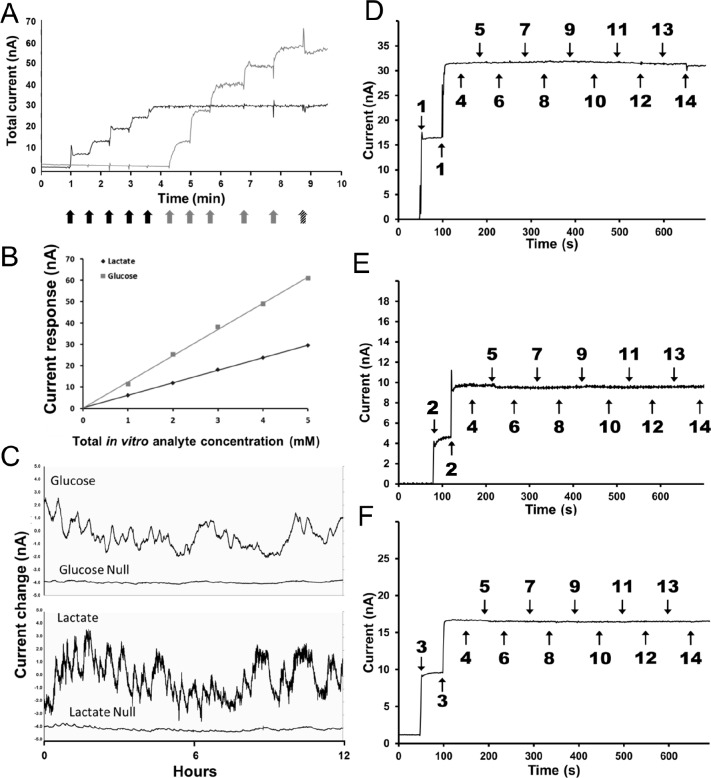
(A) Post-calibration curve for both a lactate (black trace) and a glucose (gray trace) sensor implanted in a mouse. Black arrows indicate addition of 0.1 mM lactate, gray arrows indicate addition of 1mM glucose, and the hatched arrow indicates 250 mM ascorbic acid addition. (B) Linearity of the sensor response to both lactate and glucose additions. (C) Simultaneous recording of active sensors for glucose and lactate along with the null sensors for each analyte implanted contralaterally within the same animal. Typical in vitroInterference test plots for biosensors: lactate (D), glutamate (E), and glucose (F). Biosensors were calibrated in 100 mM phosphate buffered saline (pH 7.4) at 37°C. The addition of analytes and interferents shown on the plots are as follows: (1) L-lactate 0.1 mM, (2) L-glutamate 10 μM, (3) D-glucose 1.0 mM, (4) norepinephrine 1.0 μM, (5) serotonin 1.0 μM, (6) dopamine 1.0 μM, (7) gamma-amino-butyric acid 1.0 μM, (8) tryptophan 2.0 μM, (9) L-cysteine 2.0 μM, (10) L-tyrosine 2.0 μM, (11) L-glutathione 2.0 μM, (12) L-glutamine 2.0 μM, (13) L-aspartic acid 2.0 μM, and (14) L-ascorbic acid 250 μM.

